What is Performance Testing?
Performance testing is a type of software testing that focuses on evaluating how a system or application performs under various conditions. It involves testing the speed, responsiveness, stability, and scalability of a system to ensure it can handle expected and peak loads effectively.
The primary goals of performance testing are to identify performance bottlenecks, validate system behavior under different loads, and ensure the system meets the performance requirements.
Key types of performance testing include :
1. Performance Testing: Measures the system's ability to handle a specific number of concurrent users or requests. It ensures the system performs as expected under normal conditions.
2. Stress Testing: Pushes the system beyond its normal capacity to understand how it behaves under extreme conditions. This helps identify the system's breaking point.
3. Spike Testing: Tests how the system responds to sudden increases or decreases in load, such as a traffic surge.
4. Endurance (Soak) Testing: Evaluates how the system performs over an extended period under a typical load, checking for memory leaks or performance degradation over time.
5. Scalability Testing: Assesses the system's ability to scale up (handle more users, requests, etc.) or scale out (expand resources like servers) while maintaining performance.
6. Volume Testing: Tests the system's ability to handle a large volume of data and ensure that it can manage the data load effectively.
UI Performance Testing
UI performance testing evaluates how an application’s user interface (UI) performs under varying user loads and conditions. It ensures the UI remains responsive, functional, and visually intact during peak and normal usage periods. By simulating real-world user interactions, this testing verifies that the UI can handle the desired number of concurrent users without slowing down, freezing, or crashing. It is essential for delivering a seamless and efficient user experience, even under stress, ensuring that the application meets usability and performance standards.
Steps to Use UI Performance Testing:
1. Access Performance Testing:
a. Navigate to the Performance Testing tab in your testing platform.
b. Select UI performance testing to be redirected to the UI load testing page where you can begin configuring your test scenario.
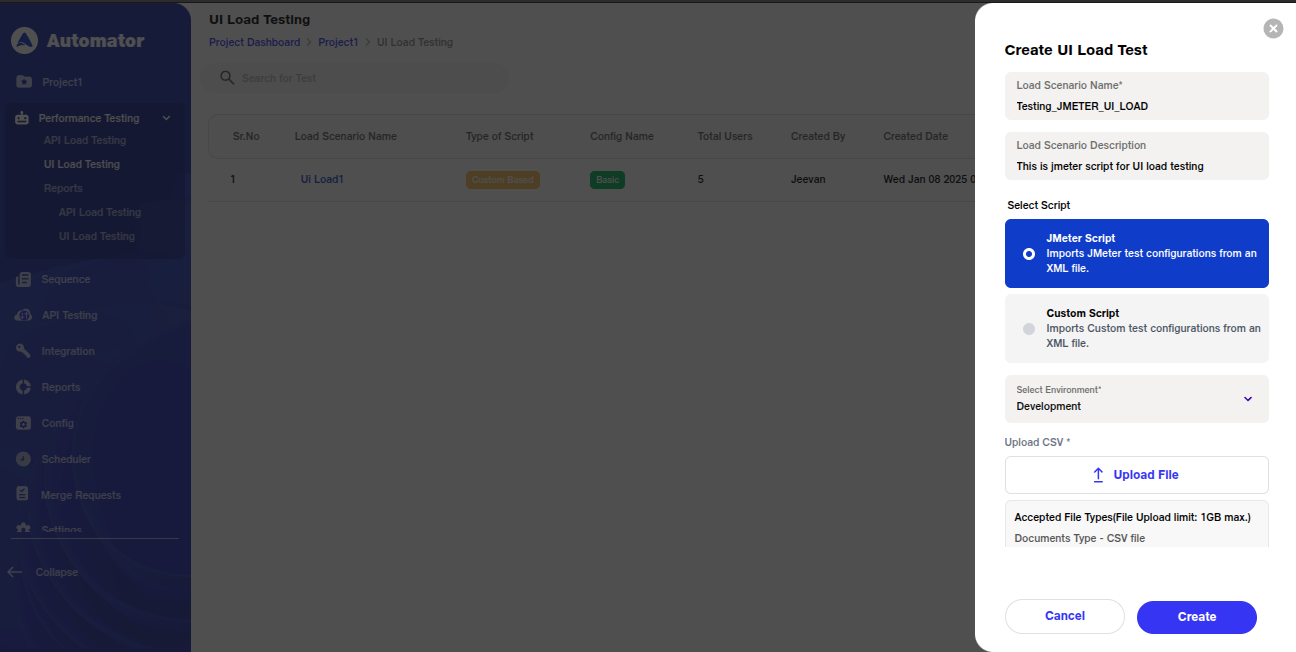
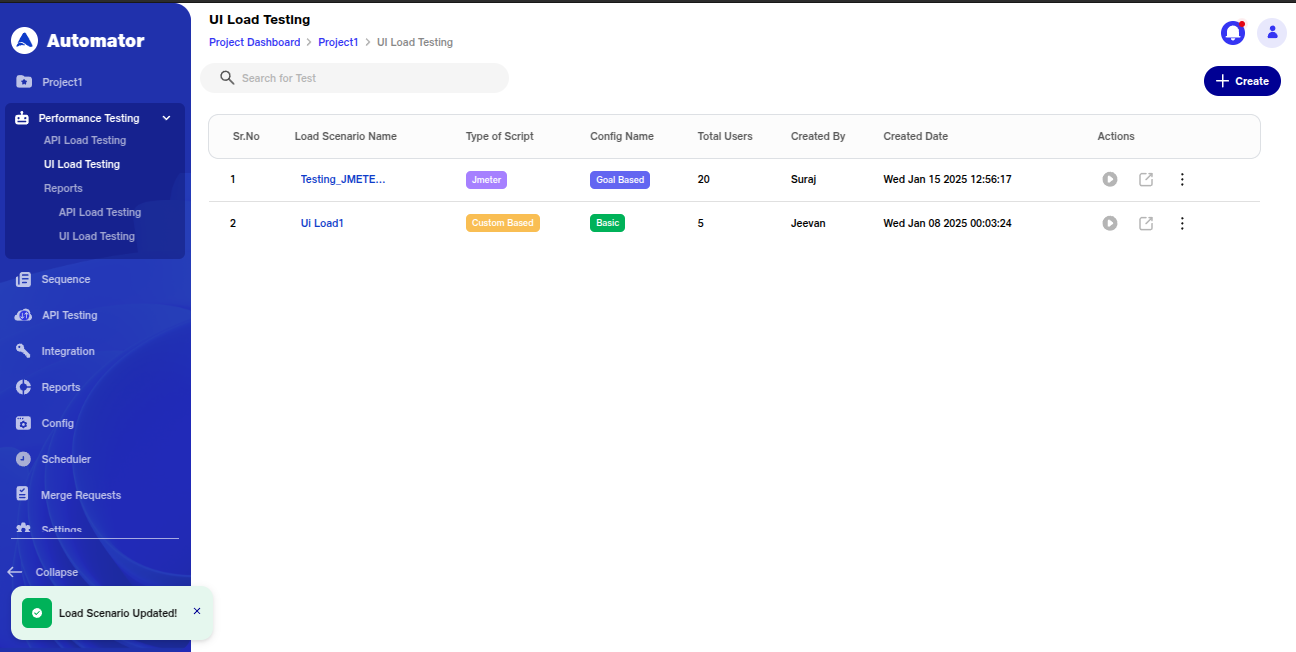
2. Create Load Test:
a. Click on the Create Load Test button. A popup will prompt you to enter the following details:
i. Load Scenario Name: Enter a descriptive name for the load testing scenario.
ii. Load Scenario Description: Provide a brief description of what the load test is evaluating.
iii. Script Type: Choose between JMeter Script or Custom Load Script.
iv. Environment: Select the appropriate environment from the dropdown list (e.g., development, staging, production).
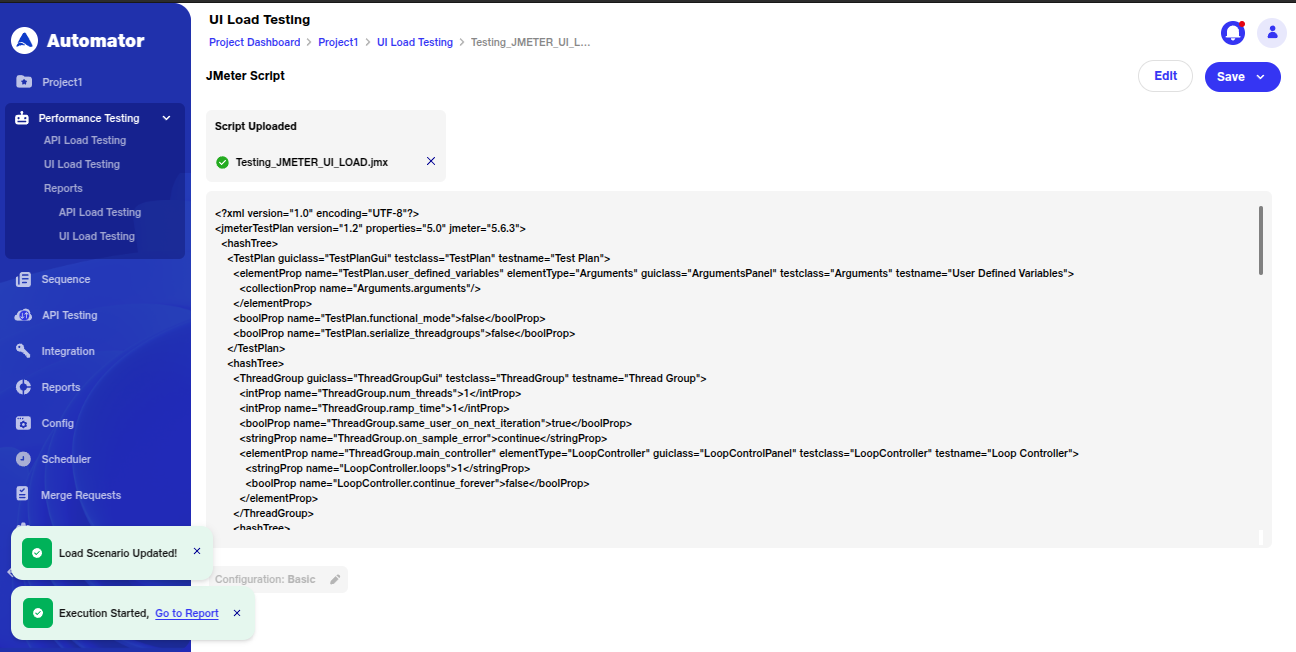
3.Using JMeter :
a. JMeter is a popular open-source tool for load testing that simulates user behavior and interactions. While JMeter is not a browser, it can look like a browser (or multiple browsers). Yet it does not perform every action supported by browsers — such as executing Javascript found in HTML pages or rendering HTML pages as a browser does. Fortunately, due to the modular architecture of JMeter, it can be extended by plugins. One of these existing plugins is WebDriver Sampler. This plugin provides a JMeter integration with Selenium so you can kick off a real browser from your JMeter test and measure metrics such as page load time, script execution time, and page rendering time.
i. Upload the JMeter script to the system for validation. If the script is valid, it will be saved and you can proceed.
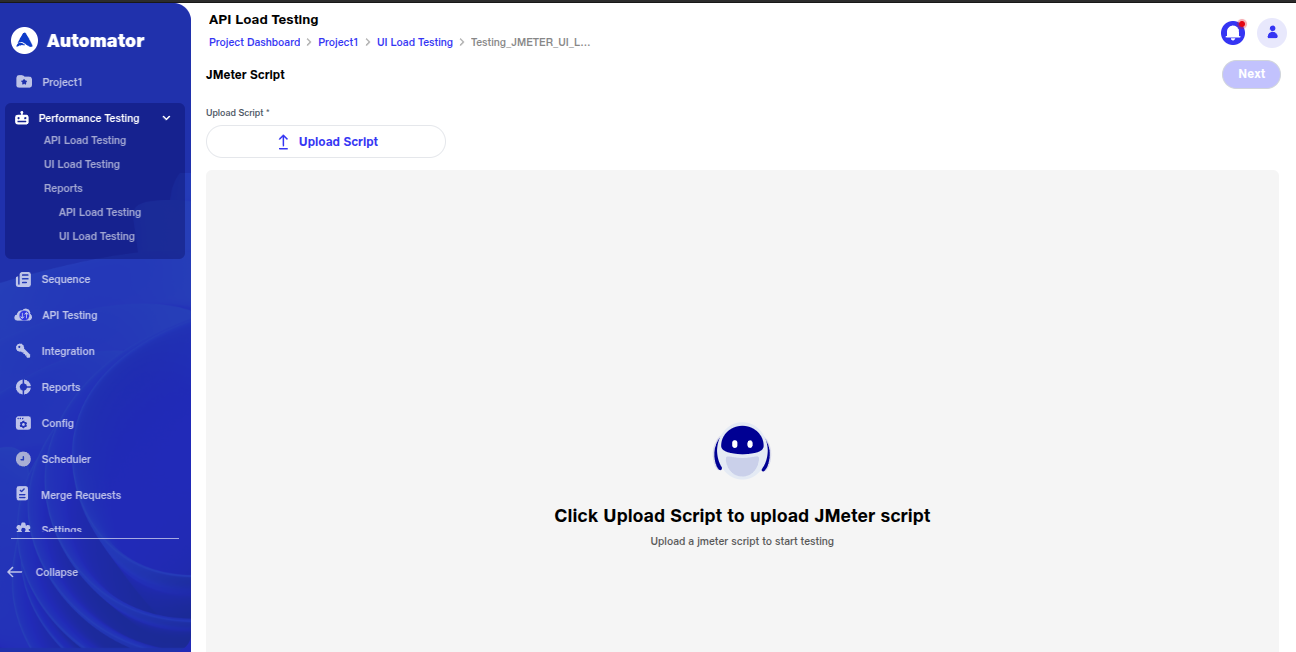
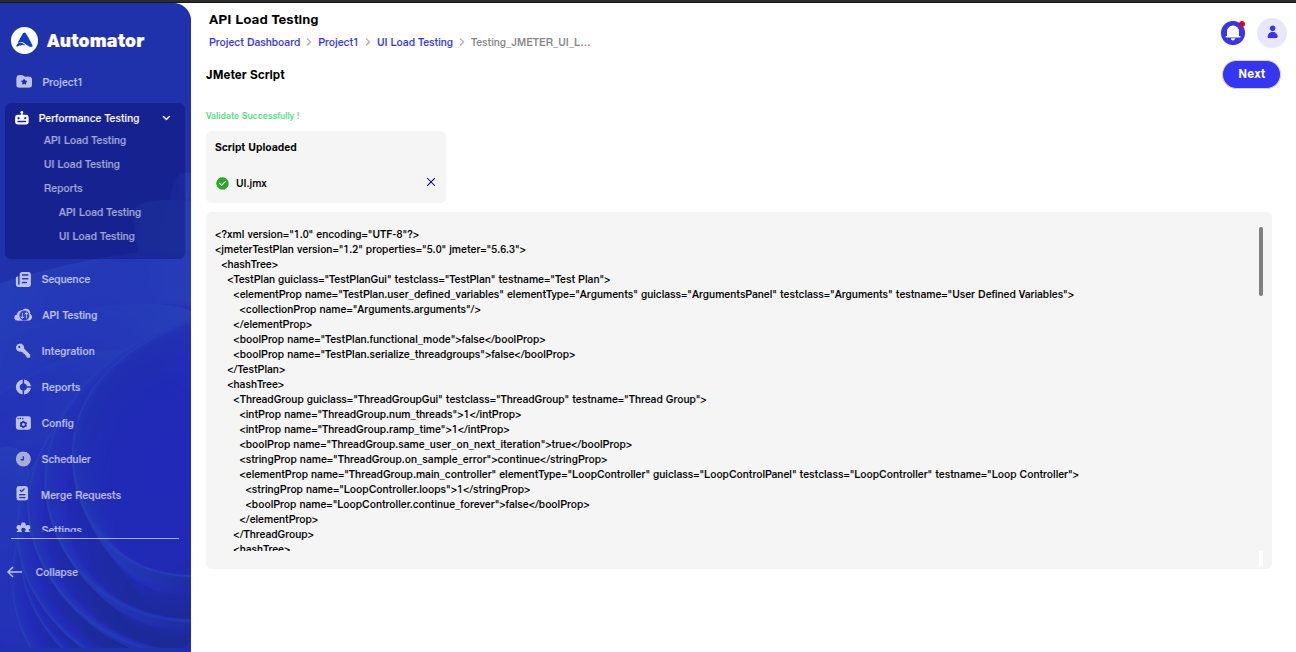
ii. If the script is invalid or there is an error, an error message will appear to guide you in troubleshooting.
4. Using Custom Load Scripts:
a. Custom Load Scripts offer more flexibility and control over the load testing process. These scripts allow you to configure specific test scenarios using step placeholders like transactions, conditions, and sequences. These scripts can be more complex than JMeter scripts, offering tailored tests based on your unique requirements.
i. Create or modify a custom script to simulate various user behaviors, including complex workflows, conditional actions, and custom error handling.
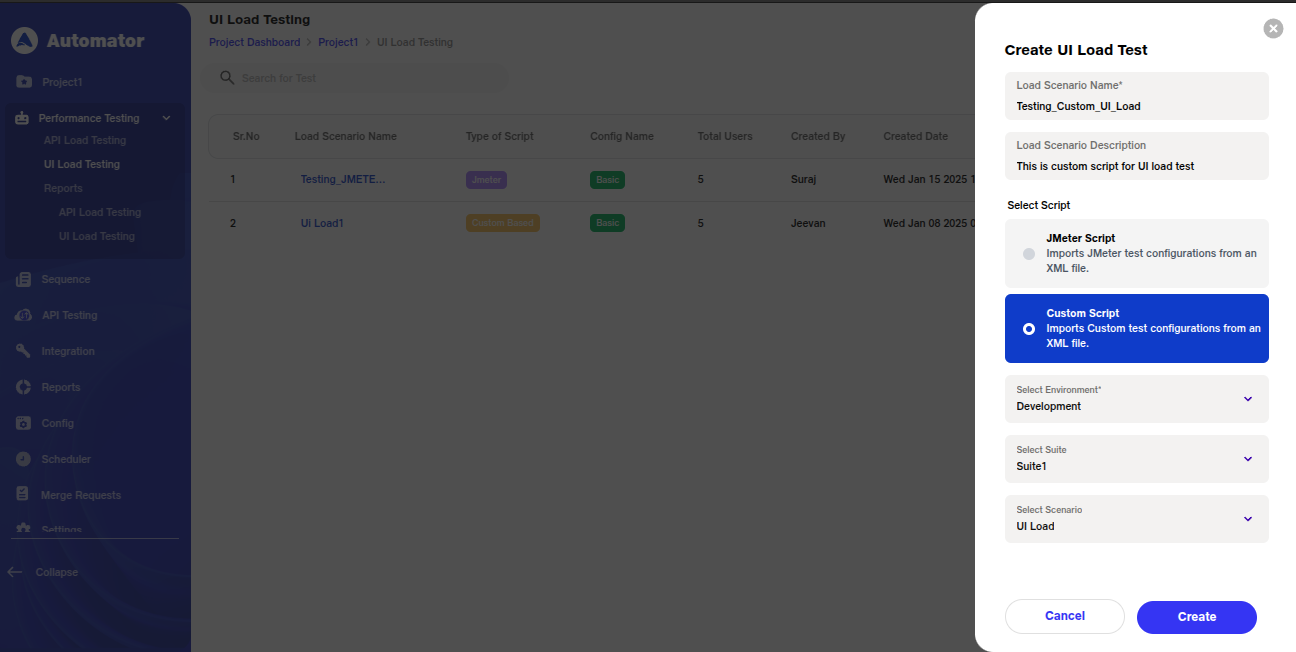
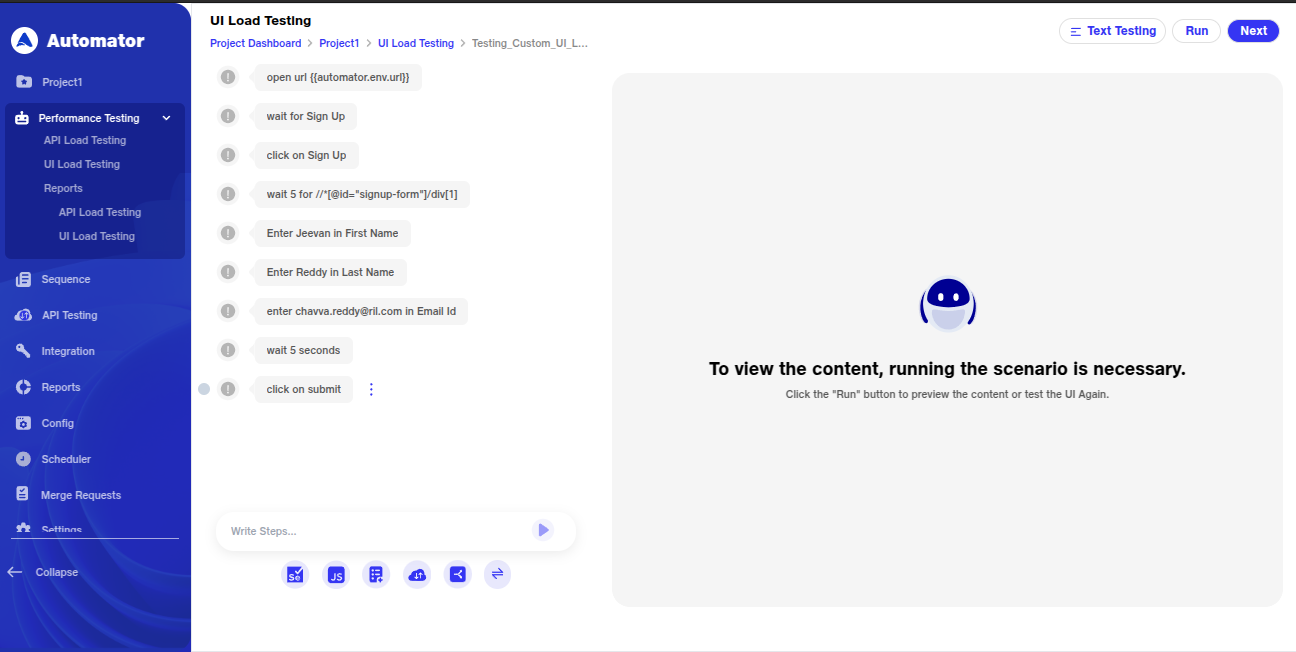
ii Use placeholders to define transactions, such as adding multiple actions or conditions based on the application’s requirements.
5. Run Details Configuration:
a. Input the details of the test setup, including:
i Run Name: The name for this specific execution.
ii Number of Thread: How many concurrent users will be simulated.
iii Environment: Choose the environment for the load test.
iv Script Type: Confirm whether you're using a JMeter script or a Custom Load Script.
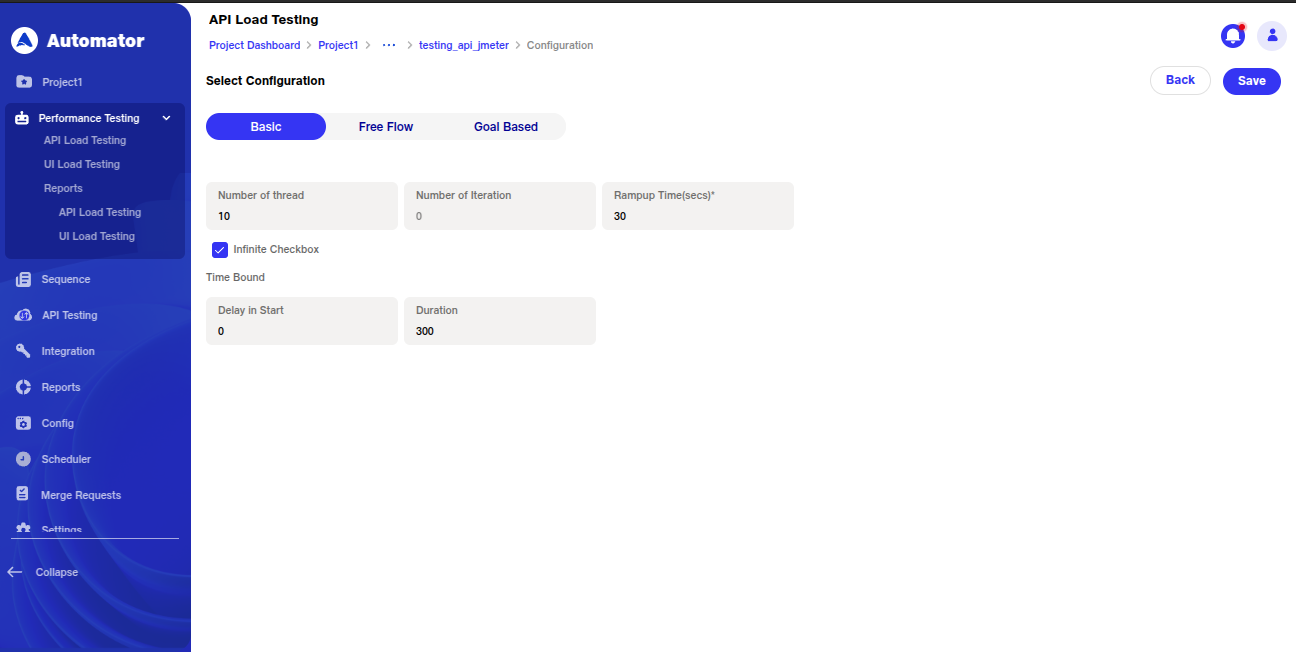
b. Choose between two configuration types:
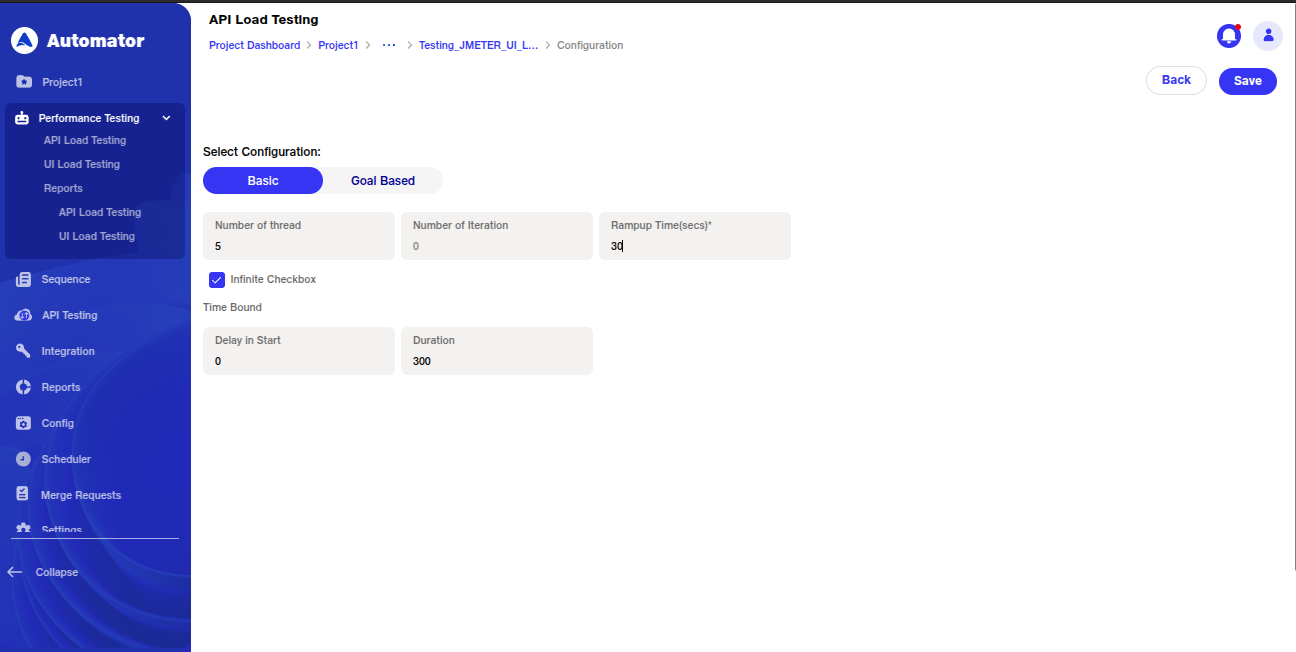
i Base Configuration:
1. Set parameters like Number of Threads, Iterations, and Ramp-up Time (the time takes to reach max concurrency load).
2. Optionally, check the box to run the test infinitely and set a start delay and duration for the test.
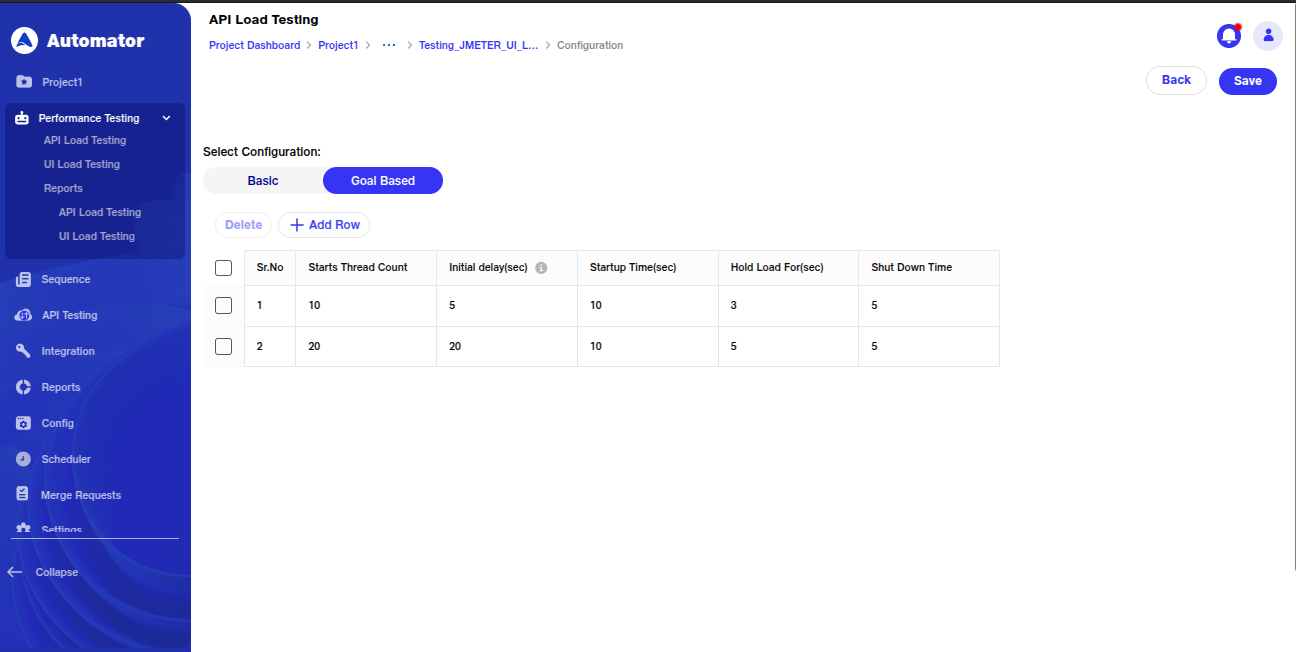
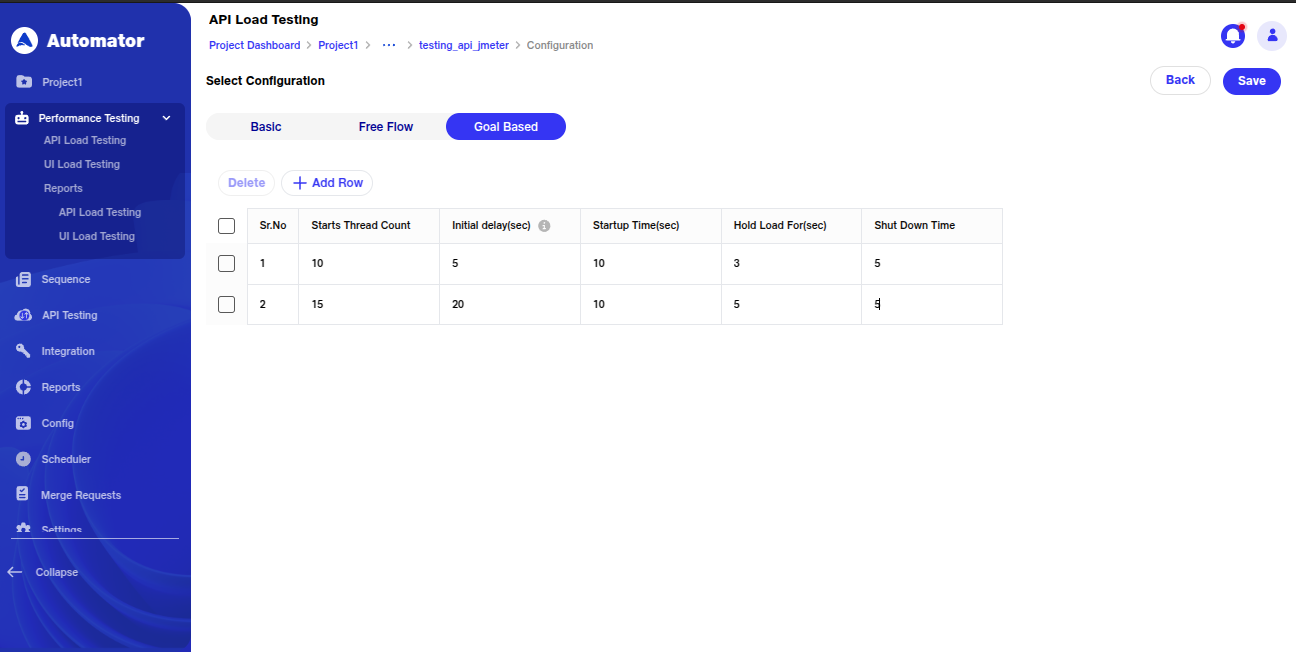
ii Goal-Based Configuration:
1. Configure options such as Start Thread Count, Initial Delay, Startup Time, Hold Load, and Shutdown Time.
2. Add or remove rows as necessary to fine-tune the test.
c. Save your configuration, and a toast message will confirm: "New UI Load Test has been successfully loaded."
6.Execute and Monitor:
a. Click Run to execute the test. Toast messages like Execution started and Execution completed indicate the progress.
b. During execution:
i. The configured load scenario is initiated, with virtual users gradually increasing as per the ramp-up time. ii. Real-time performance metrics, including response times, error rates, and resource utilization, are displayed on the dashboard.
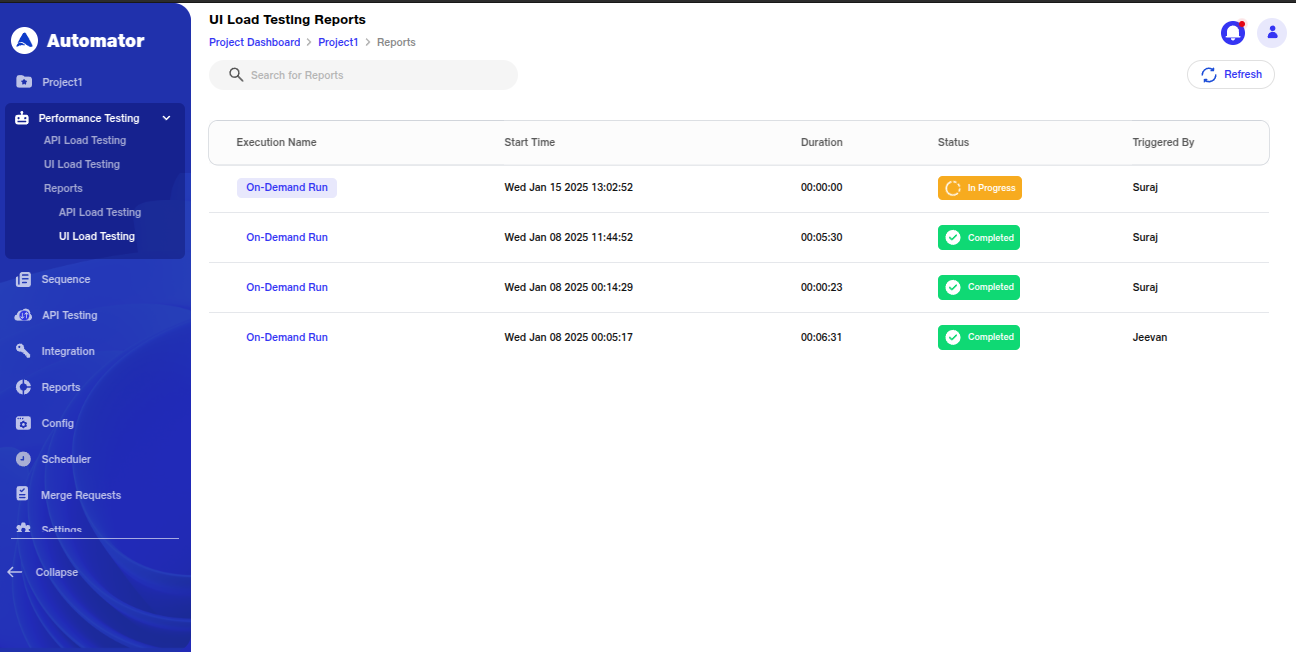
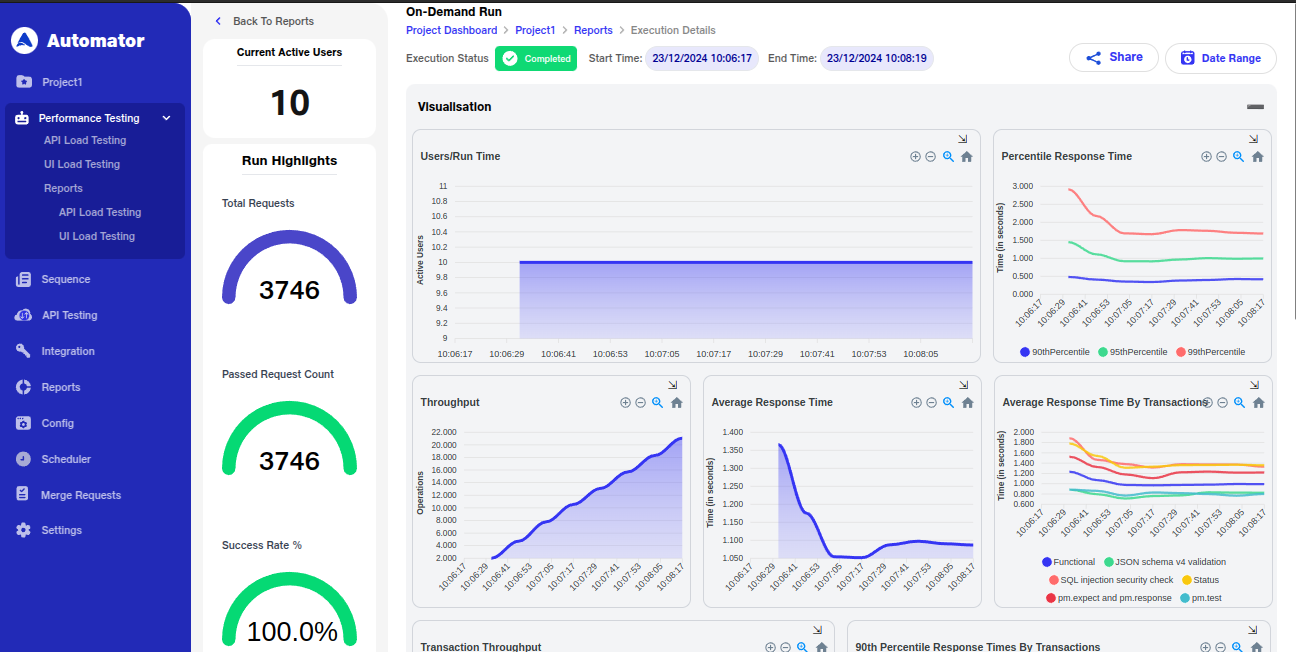
7. Reports and Actions
Once the execution is completed, a summary report reflects key metrics, including:
a. Peak user load handled.
b. Average and maximum response times.
c. Errors encountered, if any.
You can filter reports by date range and perform actions such as editing, deleting, or re-running the tests. You also have the option to share reports privately or publicly.
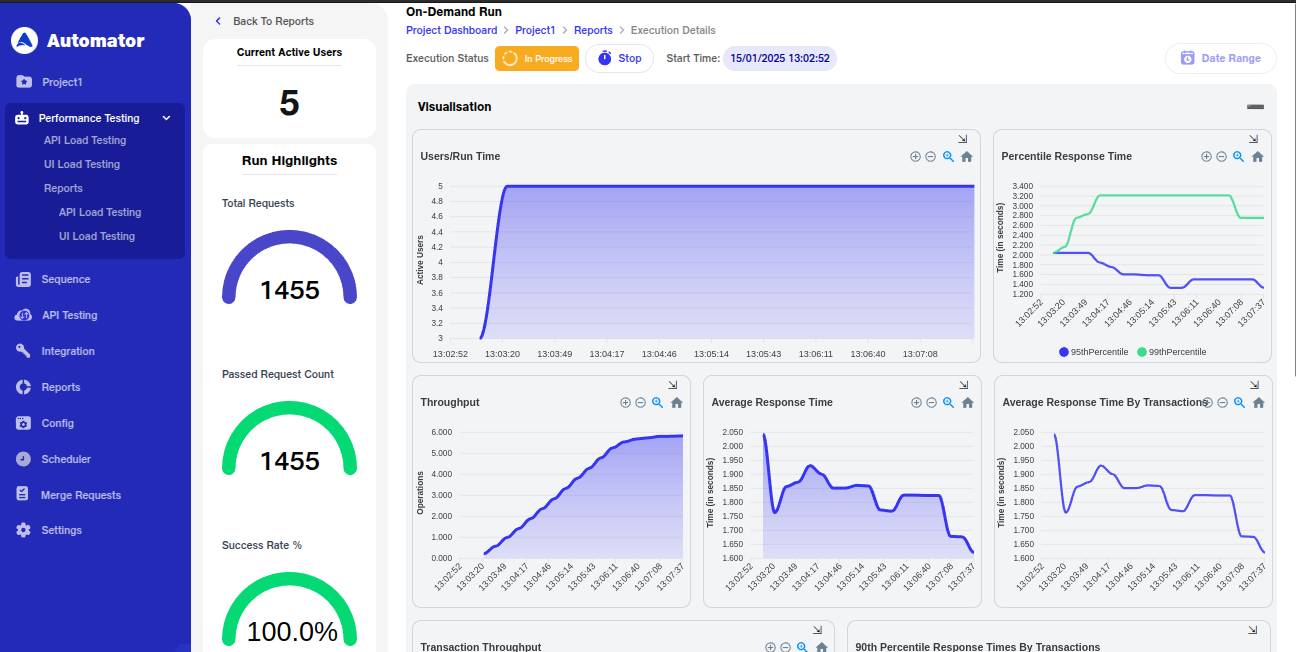
1.Peak User Load Handled
Indicates the maximum number of concurrent users the system successfully handled during the test. Validates the system's scalability and its ability to support peak traffic without performance degradation.
2.Average and Maximum Response Times
Reflects the average and highest time taken by the system to respond to user requests. Lower response times indicate better performance, while high maximum response times might signify bottlenecks or issues with specific transactions.
3. Errors Encountered
Summarizes errors that occurred during the test, including types and frequency. Helps identify vulnerabilities or malfunctions within the system under load.
4.Users/Run Time
Shows how users ramp up to the peak load, maintain a steady load, and gradually ramp down. Validates the load configuration and simulates real-world usage patterns.
5. Percentile Response Time
Displays the maximum response times for the fastest 90%, 95%, and 99% of requests. Occasional spikes highlight areas needing further investigation for optimization.
6. Throughput
Represents the number of transactions processed per second during the test. Peaks when the user load stabilizes and decreases as the load reduces, reflecting system capacity and behavior.
7. Average Response Time
Highlights the system's efficiency in handling requests on average. Consistently low average response times indicate strong performance under load.
8. Average Response Time by Transaction
Shows the average time taken for individual transactions, helping pinpoint which ones, such as "Login" or "Answer Survey," require optimization to improve overall user experience.
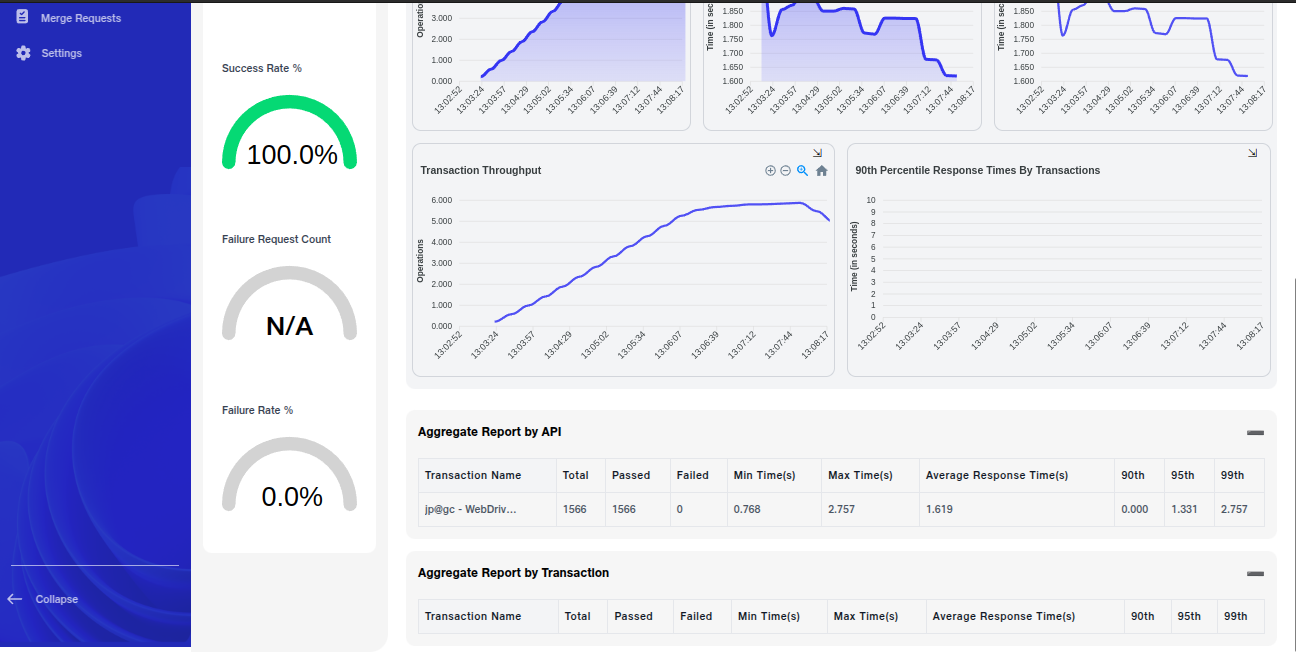
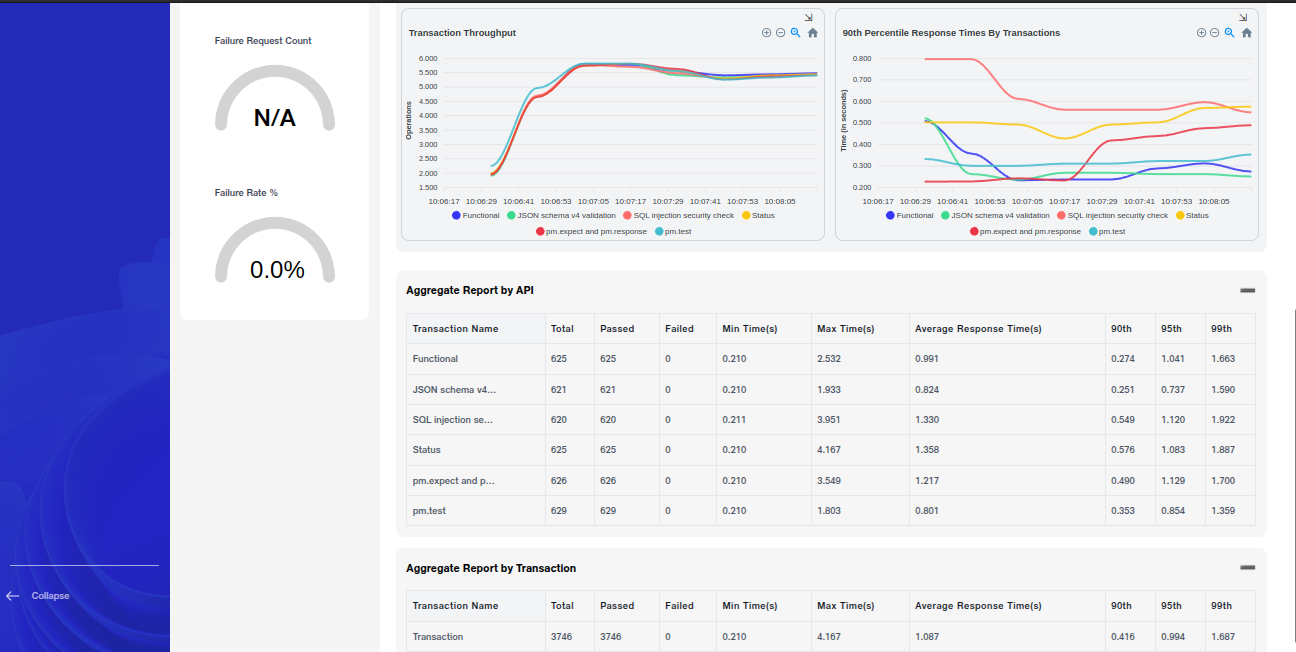
9. Transaction Throughput
Tracks the number of specific transactions processed per second. Higher throughput for transactions like "Get Current Event" and "Login" indicates their importance in the system's overall operation.
10. 90th Percentile Response Times by Transaction
Highlights the maximum response times for the fastest 90% of individual transactions. Longer response times for transactions like "Answer Survey" and "Login" indicate potential bottlenecks.
11. Aggregate Report by API
Summarizes the performance of all APIs tested, including success rates and average response times. Identifies APIs requiring further optimization to handle peak performance demands.
API Performance Testing
API Performance testing evaluates how well an API performs under varying levels of traffic. It is crucial for ensuring that the API can handle a large number of concurrent requests without failure. This testing helps identify performance bottlenecks, validate response times, and assess throughput, ensuring smooth integration with other systems.
Steps to Use API Performance Testing:
1. Access Performance Testing:
a. Navigate to the Performance Testing tab.
b. Select API Testing to go to the API load testing page where you can configure your load test.
2.Create Load Test:
a. Click on the Create Load Test button. A popup will prompt you to enter the following details:
i. Load Scenario Name: Name your test scenario.
ii. Load Scenario Description: Provide a brief description of the API load test.
iii. Script Type: Choose between ** JMeter Script ** or ** Custom Load Script. **
iv. Environment: Select the appropriate environment for testing.
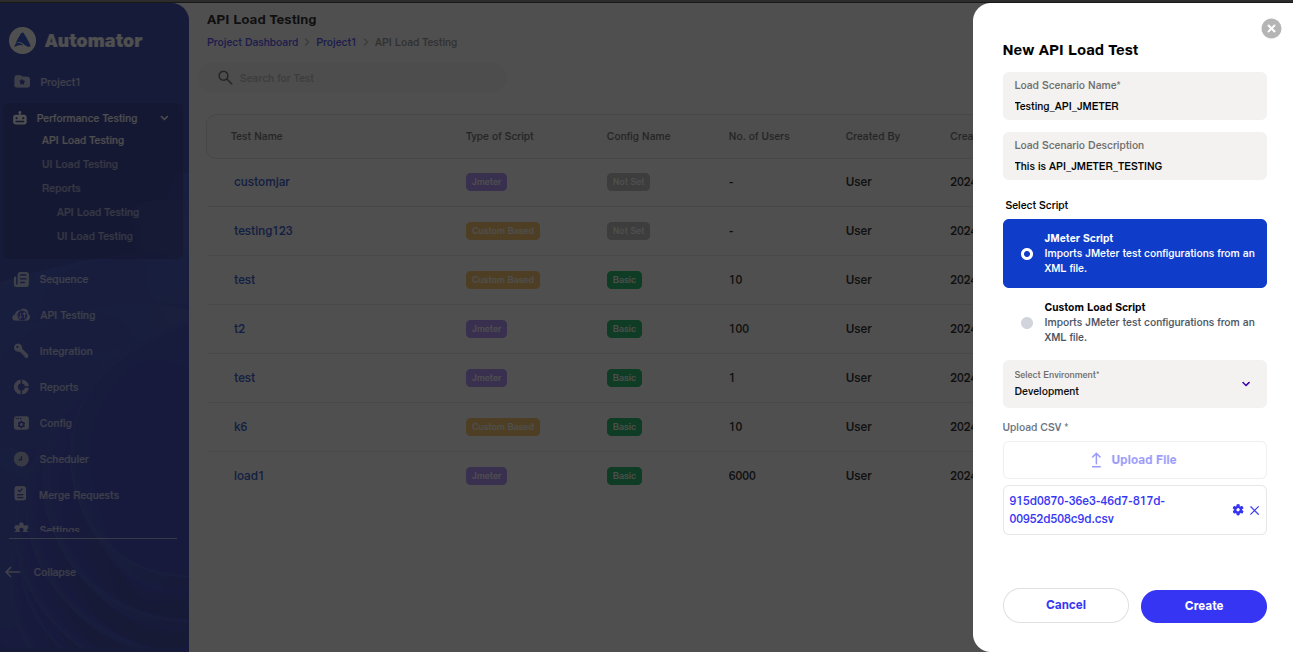
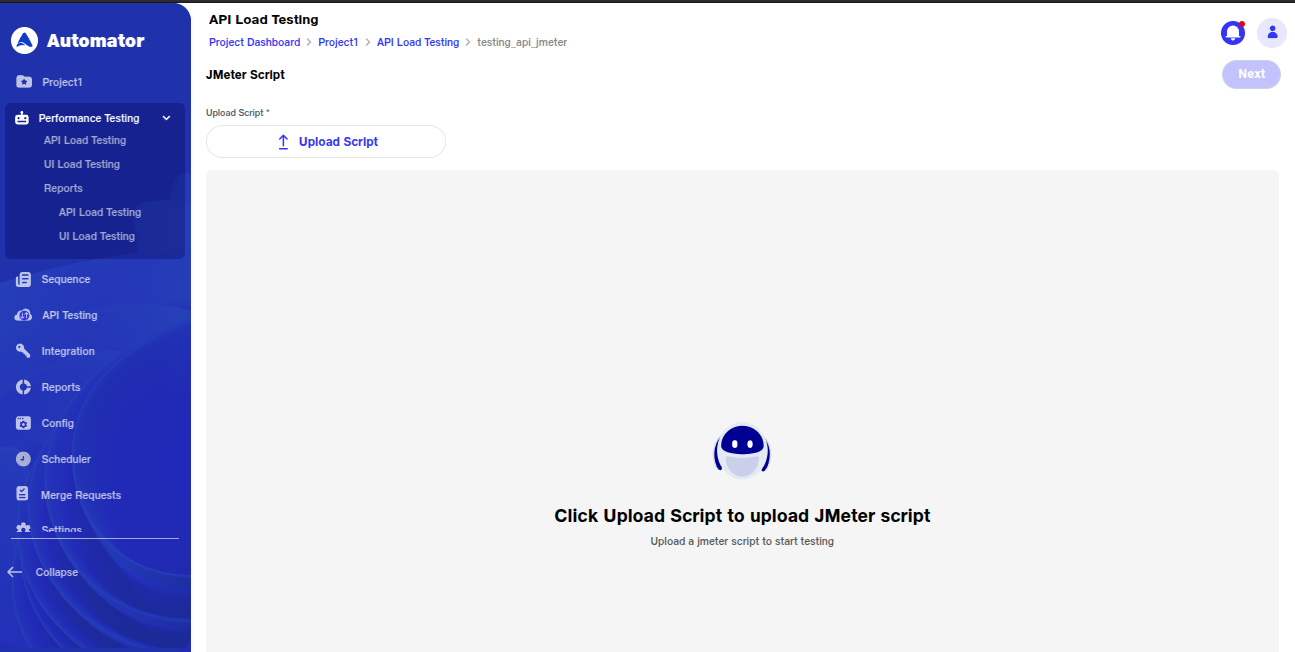
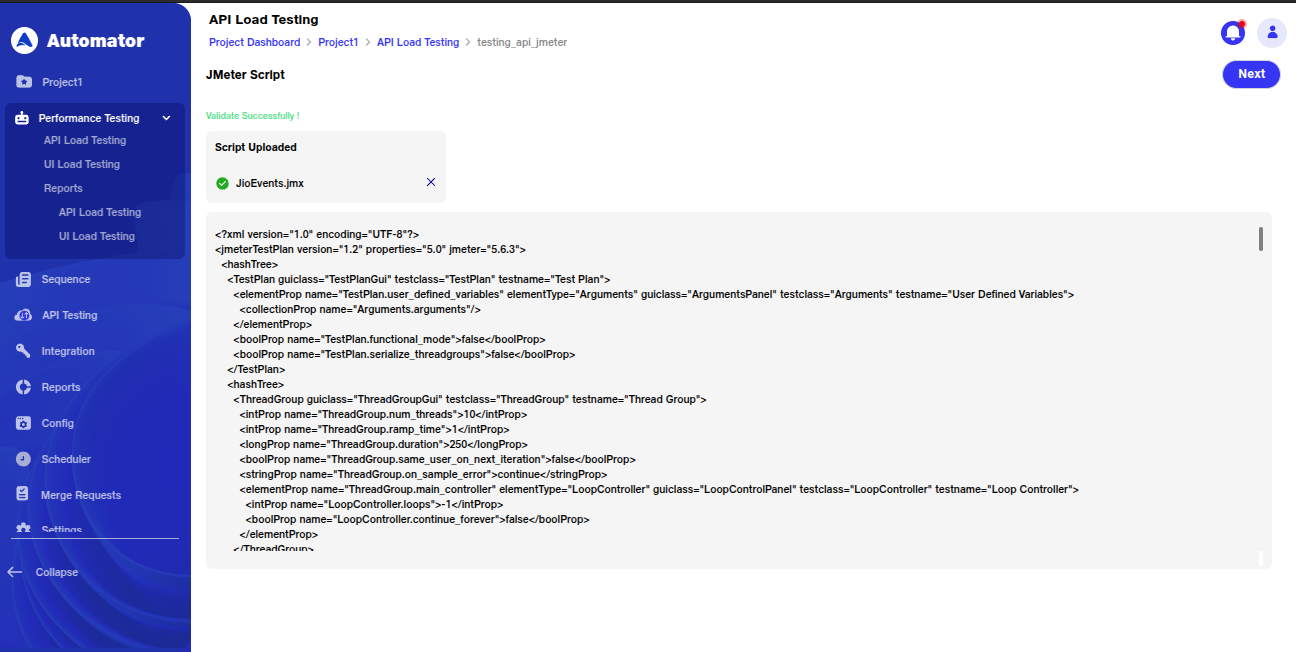
3.Using JMeter Script:
a.** JMeter Script ** simulates API requests under load. It is widely used for performance testing because of its flexibility and support for a wide range of protocols.
** i. Upload the JMeter script ** for validation. After the upload, configure the run details as per the configuration options available. ii. If there are any issues with the JMeter script, the system will notify you with an error message, allowing you to correct the issue.
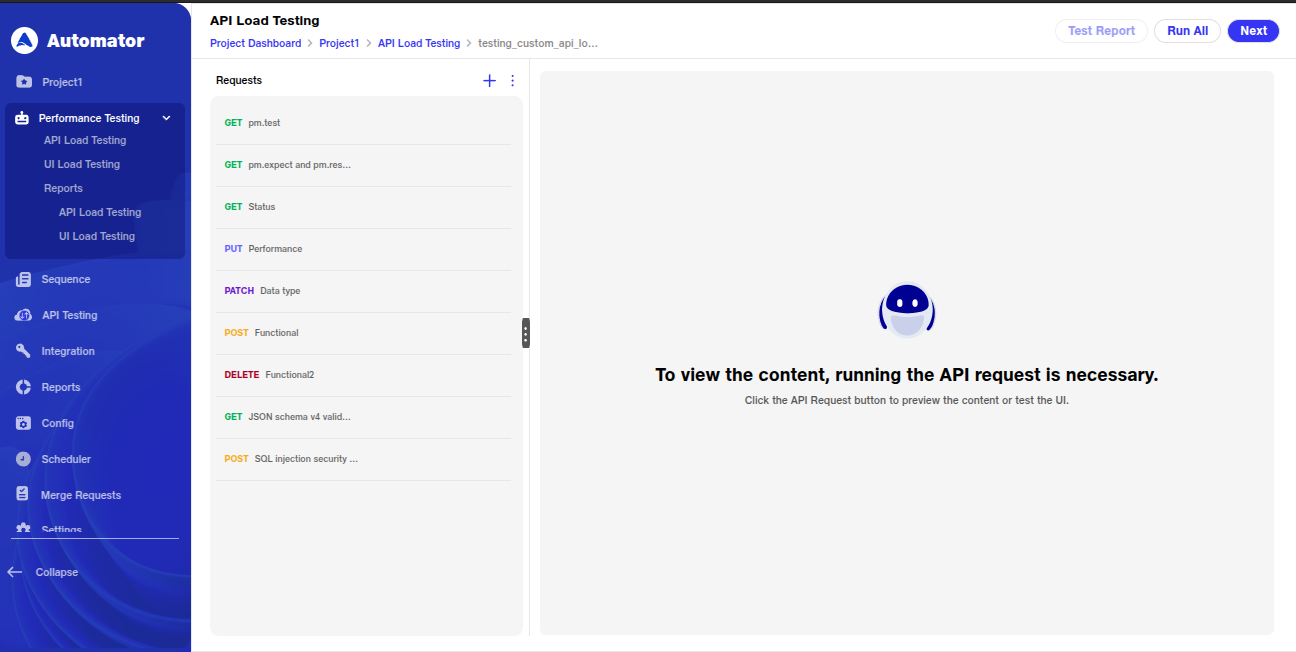
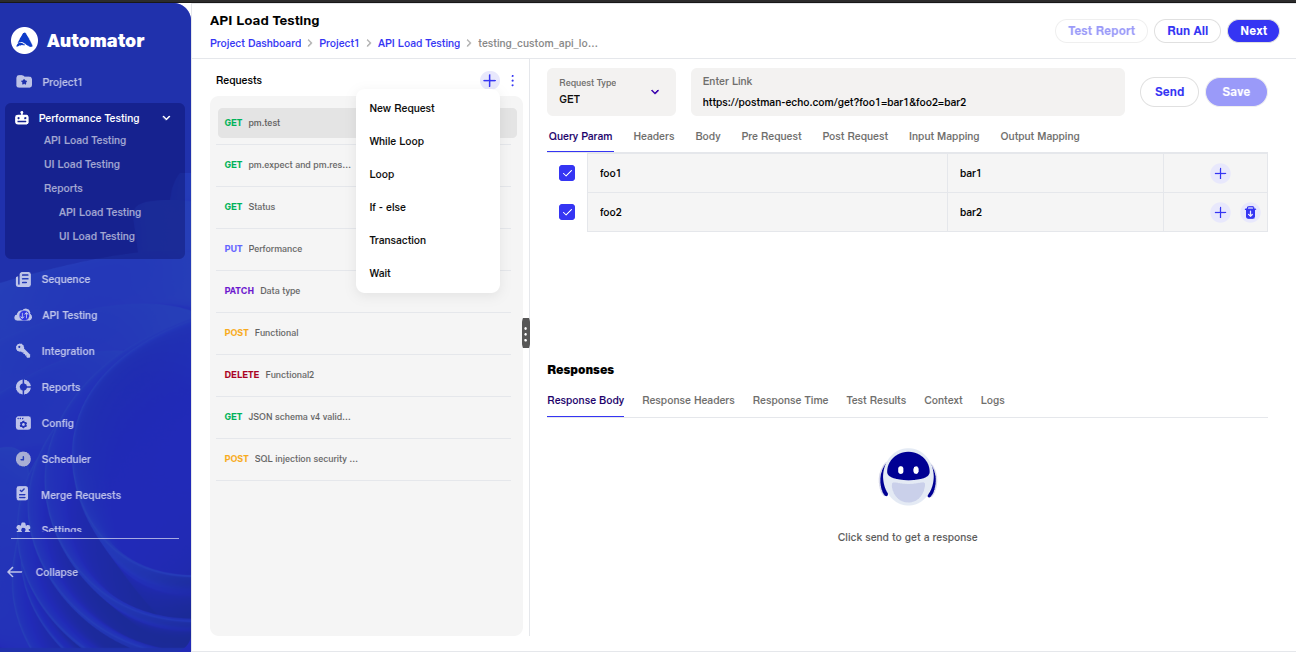
4. Using Custom Load Scripts:
a. Custom Load Scripts allow for a highly tailored load testing scenario. You can import an API collection or upload a CSV file containing test data.
i. Configure the CSV settings, such as the delimiter and end-of-file (EOF) actions.
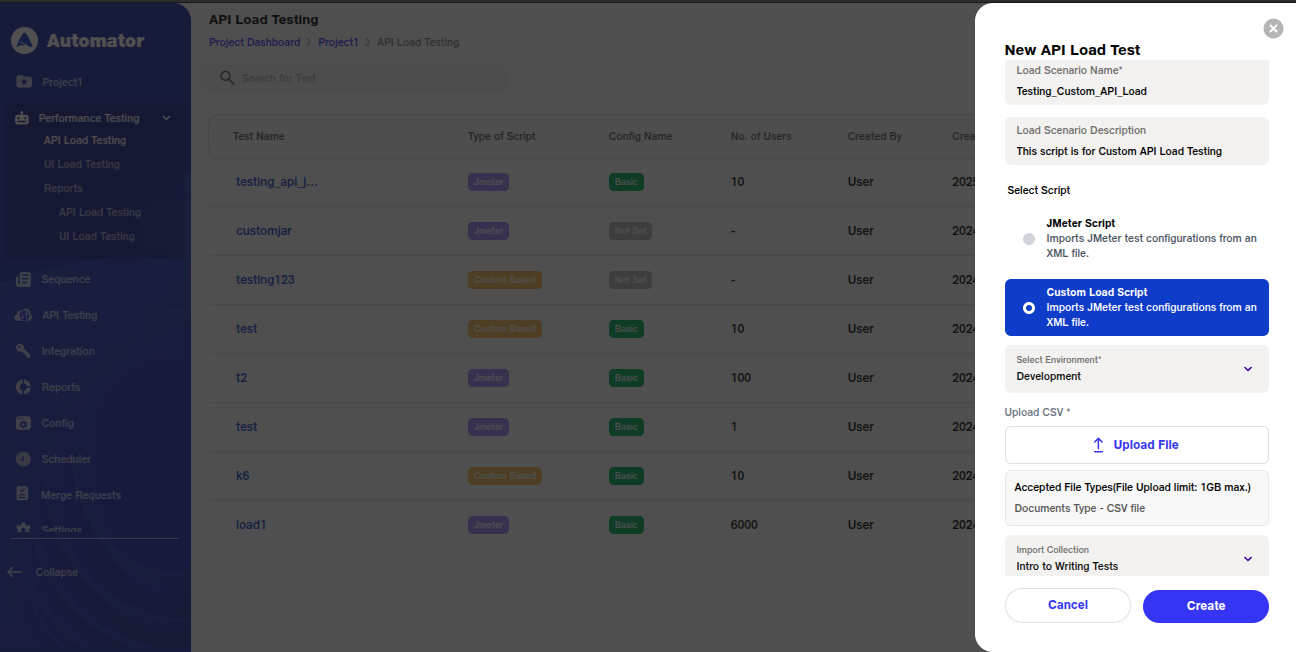
ii. Add custom API requests or use placeholders for defining transactions, conditions, and sequences to simulate specific test scenarios.
5. Run Details Configuration:
a. Similar to UI Load Testing, you will need to input details such as Run Name, Number of Users, Environment, and Script Type.
b. You can choose between Base Configuration and Goal-Based Configuration, just like UI load tests.
c. Save your configuration, and the system will confirm with the toast message: "New API Load Test has been successfully loaded."
6. Execute and Monitor:
a. Click Run ALL to execute the test. b.Toast messages like Execution started and Execution completed indicate the progress. c.During execution:
i. The configured load API is initiated, with virtual users gradually increasing as per the ramp-up time.
ii. Real-time performance metrics are displayed on the dashboard, including response times, error rates, and resource utilization.
iii.If thresholds are breached, alerts or warnings will highlight areas requiring attention.
7. Reports and Actions Once the execution is completed, a summary report reflects key metrics, including:
a. Peak user load handled.
b. Average and maximum response times.
c. Errors encountered, if any.
You can filter reports by date range and perform actions such as editing, deleting, or re-running the tests. You also have the option to share reports privately or publicly.
1. Peak User Load Handled
Indicates the maximum number of concurrent users the system successfully handled during the test. Validates the system's scalability and its ability to support peak traffic without performance degradation.
2. Average and Maximum Response Times
Reflects the average and highest time taken by the system to respond to user requests. Lower response times indicate better performance, while high maximum response times might signify bottlenecks or issues with specific transactions.
3. Errors Encountered
Summarizes errors that occurred during the test, including types and frequency. Helps identify vulnerabilities or malfunctions within the system under load.
4. Users/Run Time
Shows how users ramp up to the peak load, maintain a steady load, and gradually ramp down. Validates the load configuration and simulates real-world usage patterns.
5. Percentile Response Time
Displays the maximum response times for the fastest 90%, 95%, and 99% of requests. Occasional spikes highlight areas needing further investigation for optimization.
6. Throughput
Represents the number of transactions processed per second during the test. Peaks when the user load stabilizes and decreases as the load reduces, reflecting system capacity and behavior.
7. Average Response Time
Highlights the system's efficiency in handling requests on average. Consistently low average response times indicate strong performance under load.
8.Average Response Time by Transaction
Shows the average time taken for individual transactions, helping pinpoint which ones, such as "Login" or "Answer Survey," require optimization to improve overall user experience.
9.Transaction Throughput
Tracks the number of specific transactions processed per second. Higher throughput for transactions like "Get Current Event" and "Login" indicates their importance in the system's overall operation.
10. 90th Percentile Response Times by Transaction
Highlights the maximum response times for the fastest 90% of individual transactions. Longer response times for transactions like "Answer Survey" and "Login" indicate potential bottlenecks.
11. Aggregate Report by API
Summarizes the performance of all APIs tested, including success rates and average response times. Identifies APIs requiring further optimization to handle peak performance demands.
Benefits of Performance Testing
1. Comprehensive Performance Insights:
Provides a complete view of system behavior by testing both the frontend (UI) and backend (APIs), ensuring performance is optimized across the entire application stack.
2.Improved Scalability:
Validates the application's ability to handle increased traffic, ensuring both the UI and APIs can scale seamlessly to meet user demands.
3. Better User Experience:
Ensures the UI remains responsive and functional while the APIs handle concurrent requests, delivering a smooth and uninterrupted experience to users.
4. Early Issue Detection:
Identifies performance bottlenecks and inefficiencies across the system before they reach production, reducing the risk of costly fixes later.
5. Reduced Downtime:
Prevents system crashes or slowdowns during peak usage by validating the resilience and stability of both the UI and APIs under load.